Vendor Spend Analysis: 2026 Guide to Data, KPIs & Savings

Is your company’s budget like a leaky bucket? You know money is going out, but it’s hard to pinpoint all the little drips and streams that add up to a significant loss. That’s a common feeling, especially when it comes to the money you spend with suppliers. This is where vendor spend analysis comes in. It’s the process of shining a bright light on every dollar you spend with your vendors to find savings, boost efficiency, and make smarter decisions.
Think of it as a financial health checkup for your procurement. The goal is to turn mountains of purchasing data into clear, actionable insights. Done right, it transforms procurement from a simple transactional function into a strategic powerhouse that saves the company real money. Yet, many struggle with it. Many Chief Procurement Officers admit they lack the data needed to spot savings opportunities. Let’s fix that.
This guide will walk you through everything you need to know about vendor spend analysis, from gathering your data to implementing changes that impact the bottom line.
What is Vendor Spend Analysis? (Key Takeaway)
Vendor spend analysis is the strategic process of collecting, cleansing, and classifying procurement data to gain visibility into organizational outflows. In 2026, it serves as the primary lever for cost optimization, allowing firms to identify "maverick" spending, consolidate suppliers, and automate contract compliance.
Top 3 ROI Drivers:
Supplier Consolidation: Reduces administrative overhead and increases volume discounts.
Tail Spend Management: Captures 5–10% savings on unmanaged, low-value transactions.
Process Automation: Reduces data errors by up to 30% using AI-driven cleansing.
The Foundation: Getting Your Data Right
You can’t analyze what you can’t see. Before any meaningful insights can be found, you have to get your data in order. This foundational step is arguably the most critical part of the entire vendor spend analysis process.
Collecting and Cleaning Vendor Data
The first step is data collection. This means gathering all your purchasing data from every corner of the business. Think about all the places spend happens: accounts payable systems, purchase orders, corporate credit cards, expense reports, and ERP systems. For large companies, this data can be siloed in dozens of different systems, making it a huge challenge to get a complete picture.
Once you have the data, the real work begins: data cleaning. Raw data is almost always messy. You might find the same supplier listed under five different names due to typos and abbreviations. In fact, it’s common for procurement teams to find that 30% duplication in the supplier master. Cleaning involves:
Data Aggregation: Combining all the raw data from different sources into one single “source of truth”.
Standardizing: Normalizing supplier names (so “IBM” and “I.B.M. Corp” are treated as one).
Correcting Errors: Fixing typos and removing outliers, like a zero dollar invoice.
This process is vital because poor supplier data quality can cost companies millions of dollars each year. Adopting strong spend data management practices can help. Many standard data cleansing tasks can be automated.
Vendor Master Data Governance
To prevent your data from getting messy again, you need vendor master data governance. This is the set of policies and processes for keeping your main supplier database clean, accurate, and consistent. It establishes rules for how new vendors are added and ensures data is regularly audited and de-duplicated. One automotive manufacturer, for instance, identified 15,000 duplicate supplier records and was able to reduce its supplier database through a data cleansing project. Good governance ensures your vendor spend analysis is always based on reliable information.
Making Sense of It All: Categorizing Your Spend
Once your data is clean and consolidated, the next step is to organize it. This is where you start turning raw numbers into a story you can understand.
Spend Categorization
Spend categorization is the process of grouping similar purchases together. Instead of looking at thousands of individual transactions, you create logical buckets like “IT Software”, “Office Supplies”, “Professional Services”, and “Travel”. Without this step, your spend data is just a confusing jumble.
Proper categorization allows you to see the big picture. For example, you might discover you’re using 10+ agencies across the company or that spending on SaaS subscriptions is growing much faster than you thought. This structured view is the starting point for strategic sourcing. When companies bring procurement oversight to previously unmanaged spend categories, they often achieve cost reductions of 10% to 25%.
Stop the Leak: Don't let unmanaged indirect spend erode your margins. [Get a Free 2026 Savings Estimate from Varisource] and see exactly where your first 15% in savings will come from.
Classification Taxonomy (like UNSPSC)
To ensure consistency in categorization, many organizations use a classification taxonomy. This is a standardized coding system for all products and services. The most common is the UNSPSC (United Nations Standard Products and Services Code), which provides a detailed, hierarchical code for nearly every item imaginable.
Using a system like UNSPSC ensures that a “laptop computer” is coded the same way across all departments, regardless of what it’s called on the invoice. This common language is the backbone of accurate spend analysis, preventing you from missing savings opportunities because things were labeled inconsistently.
Direct vs. Indirect Spend Categorization
A fundamental way to organize spend is to split it into two main types: direct and indirect.
Direct Spend: This is money spent on goods and services that go directly into your final product. For a car maker, this would be steel, tires, and engine components.
Indirect Spend: This is money spent on everything else needed to run the business. This includes things like software, marketing services, utilities, and office furniture.
While direct spend is often tightly managed, indirect spend can be a huge, often overlooked, opportunity for savings. In many companies, indirect spend accounts for 50% or more of total purchases. Because it’s fragmented across many departments and suppliers, it’s ripe for optimization. This is exactly where services that specialize in finding hidden savings can provide immense value. By using group buying power and benchmark data, programs like the one from Varisource help companies tackle this complex area and unlock significant cost reductions.
Direct vs. Indirect Spend: Comparison for 2026
Feature | Direct Spend | Indirect Spend |
Definition | Materials/goods for final product. | Operating expenses (OpEx) and overhead. |
Examples | Raw materials, hardware components. | SaaS, marketing, travel, office supplies. |
Typical Management | Highly centralized/automated. | Often fragmented (Maverick Spend). |
Savings Potential | Narrow margins, high volume leverage. | High (10%–25%) through consolidation. |
Primary KPI | Cost of Goods Sold (COGS). | Spend Under Management (SUM). |
Uncovering Insights: Core Analysis Techniques
With your data cleaned and categorized, it’s time for the exciting part: the actual analysis. This is where you hunt for patterns, anomalies, and, most importantly, savings opportunities.
How to Analyze Vendor Spend Data
To analyze vendor spend data is to ask critical questions of your information. Using business intelligence (BI) tools or specialized analytics software, you can dig into your spend to find answers to questions like:
Who are our top 10 suppliers by spend?
How much are we spending per business unit?
Are we using too many suppliers for the same category?
Where is off-contract or “maverick” spending happening?
How has our spending with a key vendor changed over the last three years?
The insights from this process can be powerful. A tech startup, for example, performed a detailed spend analysis and found overlapping SaaS subscriptions and excessive cloud costs, leading to savings of around $200,000 annually with focused SaaS spend optimization. A thorough vendor spend analysis almost always pays for itself by revealing inefficiencies and waste.
Spend Cube Analysis

A powerful technique for this is spend cube analysis. Imagine your data in a 3D cube with three dimensions:
Suppliers (Who you bought from)
Categories (What you bought)
Business Units or Time (Who in the company bought it or when)
This multi-dimensional view allows you to slice and dice the data in any way you want. You could look at one category and see all the suppliers you use, or look at one supplier and see every category you buy from them across all departments. A spend cube helps you find hidden savings “in every corner of the business” by revealing patterns you’d miss in a simple 2D report.
Taking Action: Strategic Spend Management
Analysis is worthless without action. The insights you gain should lead to specific strategies to optimize your spending, enforce compliance, and build better supplier relationships.
Tail Spend Management
In most companies, the 80/20 rule applies: 80% of spend is with the top 20% of suppliers. The remaining 20% of spend is spread across a massive “long tail” of 80% of your suppliers. This tail spend is often unmanaged, full of one-off purchases and inefficiencies.
Tail spend management aims to bring this area under control. Cost reduction strategies include consolidating purchases with preferred vendors or using automated buying platforms. Effectively managing this area can yield 5 to 10% savings on that portion of your spend, which can add up to millions.
Supplier Consolidation
Supplier consolidation is the strategy of reducing your total number of suppliers to concentrate your spending with fewer, more strategic partners. By giving more business to a smaller group of vendors, you can negotiate better volume discounts, reduce administrative overhead, and build stronger, more collaborative relationships. For example, Coca-Cola Bottling Co. Consolidated centralized its sourcing and planning, which led to a 15% improvement in customer service and a 50% reduction in inventory.
Maverick Spend Reduction
Maverick spend is any purchasing that happens outside of your company’s approved procurement channels and contracts. It’s “rogue” buying that bypasses negotiated discounts and controls. On average, organizations lose an estimated 10 to 20% of their potential savings due to maverick spend.
The main cause is often that employees simply don’t know or disregard procurement policy. Reducing it involves a mix of better technology (like user friendly e-procurement systems), employee education, and clear communication. Top performing procurement teams make this a high priority.
Contract Compliance Monitoring
Just because you negotiated a great contract doesn’t mean you’re getting the savings. Studies show that as much as 16% of negotiated savings are lost due to maverick buying. This is known as “savings leakage”.
Contract compliance monitoring is the process of tracking purchases against your contracts to plug these leaks. It involves verifying that suppliers are billing you at the correct rates and that your employees are buying from preferred vendors.
Implementing a Vendor Change Plan
After your vendor spend analysis identifies an opportunity (like switching to a lower cost supplier or consolidating spend), you need an implement vendor change plan. This is the action phase where you execute the change. It involves getting stakeholder buy in, managing the transition, and communicating with both the old and new suppliers. It’s the critical follow through that turns an insight on a spreadsheet into actual, tangible savings. This is often where external partners can help by managing the execution, ensuring that identified savings are captured without overburdening your internal teams.
Beyond Savings: Using Spend Data for Risk Mitigation
Vendor spend analysis is your early warning system. By analyzing your data through a risk lens, you can identify:
Single-Source Dependency: Spotting categories where 100% of spend goes to one vendor (a major supply chain risk).
Geopolitical Concentration: Identifying spend clusters in volatile regions.
Financial Health Alerts: Sudden shifts in payment terms or frequency that may indicate a vendor is in financial distress.
Measuring Success: Key Metrics and KPIs
To know if your efforts are working, you need to track the right metrics. These KPIs will tell you where you’re succeeding and where you need to improve.
Spend Visibility Metric: Often called “spend under management”, this measures what percentage of your company’s total spend is actively seen and managed by procurement. World class organizations often have over 90% of their spend under management.
Number of Active Vendors: This simple count reveals the size and complexity of your supplier base. Large companies can have a staggering number of suppliers; Walmart, for instance, works with over 100,000. Tracking this helps identify opportunities for consolidation.
Spend Concentration by Vendor: This measures how your spend is distributed. On average, Depending on industry, about 3.5%–8.5% of a company’s suppliers account for 80% of total spend. This metric helps you balance the benefits of volume leverage against the risks of being too dependent on a few key suppliers.
Vendor Performance Scorecard: This is a report card for your key suppliers, tracking their performance on metrics like on time delivery, quality, and cost. It provides an objective way to manage relationships and drive continuous improvement.
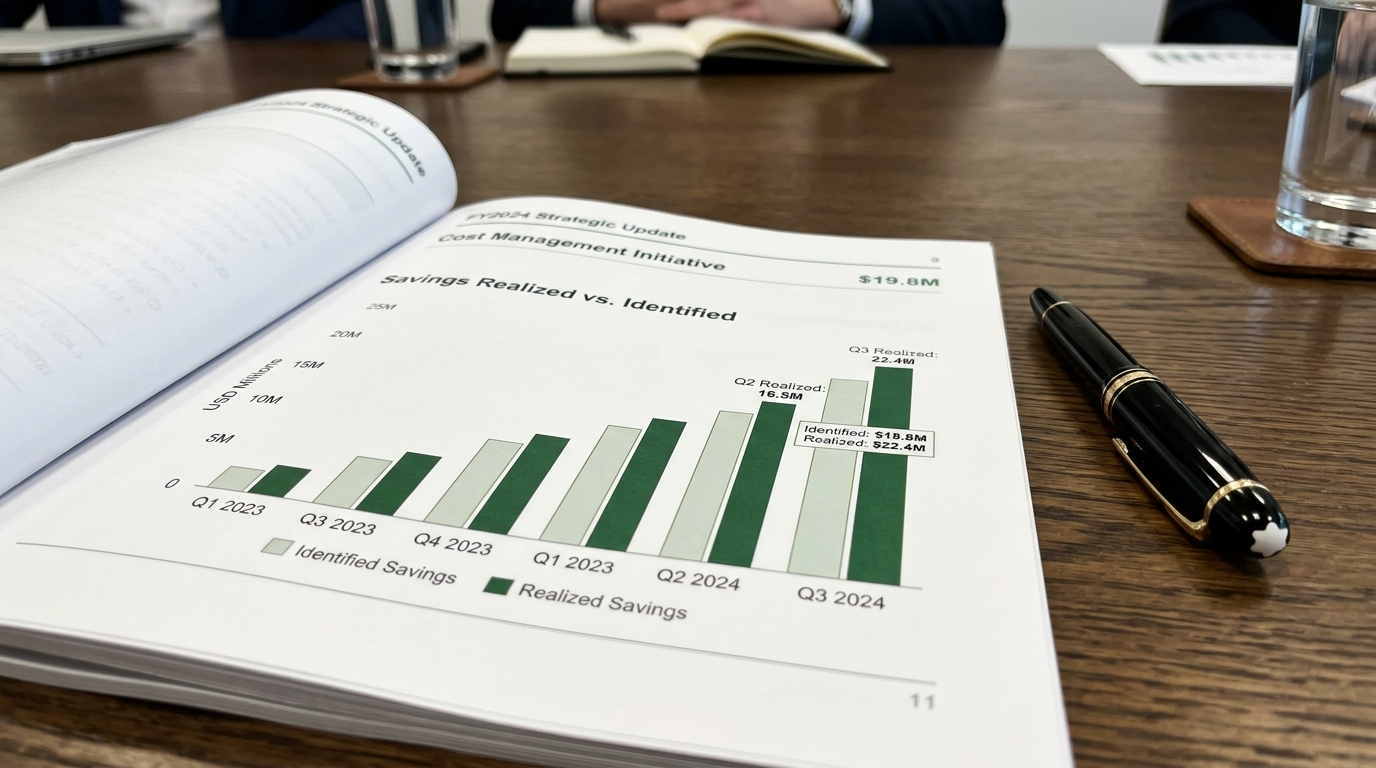
Savings Realized vs. Identified: This critical metric compares the savings you actually achieved (realized) to what you initially projected (identified). It’s the ultimate measure of your team’s effectiveness, as finance leaders (CFOs) only care about the savings that actually hit the P&L.
Stakeholder Engagement: This isn’t a hard number, but it’s crucial. It refers to how well you collaborate with internal departments. High engagement leads to better compliance and smoother implementation of savings initiatives. A great way to kickstart this is with a data driven report that shows clear savings potential, like a free Savings Estimate from Varisource, which can quickly get executive buy in.
KPI Name | 2026 Industry Benchmark | Why it Matters |
Spend Under Management | > 85% | Indicates procurement’s influence. |
Maverick Spend Rate | < 5% | Prevents "leaky bucket" budget loss. |
Supplier Count Reduction | 10% YoY | Drives volume-based pricing. |
Data Accuracy Rate | > 98% | Ensures executive trust in reports. |
Powering Your Process: Technology and Continuous Improvement
Modern vendor spend analysis is powered by technology and a commitment to getting better every day.
Automation and Tool Selection
Manual analysis in spreadsheets doesn’t scale. Modern tools automate data aggregation, cleansing, and categorization using AI procurement cost-savings tools. They can also automate workflows to enforce compliance and reduce maverick spend. In fact, research shows that 31% of organizations that implement an e procurement solution achieve better control over rogue spending.
The 2026 Spend Analysis Tech Stack
Traditional spreadsheets are no longer sufficient for real-time procurement. To stay competitive, your tech stack should include:
AI-Powered Classification: Uses Machine Learning (ML) to auto-categorize 95% of line items without human intervention.
Predictive Analytics: Forecasts price fluctuations in raw materials to trigger "buy" signals.
Real-time Dashboards: Replaces quarterly reports with live feeds from ERP and API-connected bank feeds.
ESG Tracking: Integrates vendor sustainability scores directly into the spend cube.
Spend Visualization Dashboard
A spend visualization dashboard turns your data into interactive charts and graphs. It’s like a cockpit for procurement, providing at a glance visibility into spending patterns, KPIs, and trends. This allows you to spot opportunities and issues in real time, rather than waiting for a quarterly report.
Continuous Monitoring and Improvement
Finally, effective vendor spend analysis is not a one time project; it’s an ongoing cycle. Continuous monitoring and improvement means perpetually tracking spend, identifying new opportunities, and refining your strategies. This Kaizen like approach ensures that your savings gains are sustained and that you are always adapting to new market conditions and business needs.
By embracing this full cycle, from data collection to continuous improvement, your organization can unlock the full potential of vendor spend analysis. It’s a journey that delivers a healthier bottom line, more efficient processes, and stronger, more valuable supplier relationships.
Frequently Asked Questions (FAQ)
1. What is vendor spend analysis in simple terms?
Vendor spend analysis is the process of collecting, cleaning, and analyzing all of your company’s purchasing data to understand who you’re buying from, what you’re buying, and how much you’re spending. The goal is to identify opportunities to save money, improve efficiency, and reduce risk.
2. How do I start a vendor spend analysis?
The first step is data collection. Gather spend data from all your sources, such as your accounts payable system, ERP, and corporate card statements. The next crucial step is to clean and consolidate this data into a single, reliable dataset before you begin categorization and analysis.
3. What are the main benefits of vendor spend analysis?
The primary benefits include significant cost savings through supplier consolidation and better negotiations, reduced maverick (off contract) spend, improved operational efficiency, better budget compliance, and a clearer view of supplier dependencies and risks.
4. What is the difference between direct and indirect spend?
Direct spend is on materials and services that become part of your final product (e.g., raw materials). Indirect spend is on everything else needed to run the business (e.g., software, utilities, office supplies). Indirect spend is often less managed and holds huge potential for savings.
5. What is a spend cube?
A spend cube is a data analysis model that looks at spend across three dimensions simultaneously, typically suppliers, spend categories, and business units. It allows you to “slice and dice” your data to uncover deep insights that a simple report might miss.
6. How can technology help with vendor spend analysis?
Modern software can automate many of the most time consuming parts of vendor spend analysis. AI powered tools can automatically collect, clean, and categorize data, visualize it in interactive dashboards, and even identify savings opportunities for you, freeing up your team to focus on strategic actions.
7. How often should we perform a vendor spend analysis?
While you might start with a one time project, the best practice is to make it a continuous process. Ongoing monitoring allows you to track performance, catch new trends, and ensure that savings are sustained over time.
8. Can a third party help with our vendor spend analysis?
Yes, many companies partner with experts who bring specialized tools, benchmark data, and execution support. Services like Varisource offer a free savings analysis to quickly identify opportunities across your indirect spend, combining powerful AI with a hands on team to ensure the identified savings become realized savings.
About the Author

Victor Hou
Victor Hou is the founder of Varisource, the first ever Savings Automation Platform that automates Savings for Your Business. Victor helps companies access discounts, rebates, benchmark data, savings for renewals and new purchases across 100+ spend categories automatically to increase your company's margins and equity value by at least 15-20%. Victor is active and passionate about using AI + automation to help your business save time, money and run more efficiently.
%201.svg)
Varisource’s Savings Automation Platform guarantees savings and maximized leverage on every dollar spend across 100+ spend categories


