Cost Cutting Strategies for Companies: Benchmarking Vendor Spend [2026]
![Cost Cutting Strategies for Companies: Benchmarking Vendor Spend [2026]](https://cdn.prod.website-files.com/61353c043de197c1b4872af8/6ac40e3aa99c8c35f29dfd22_6ac40e39eaef500bb8ca8fd0_img-5656e06d-098b-4e98-b1dd-3ac9ba8cac3a.webp)
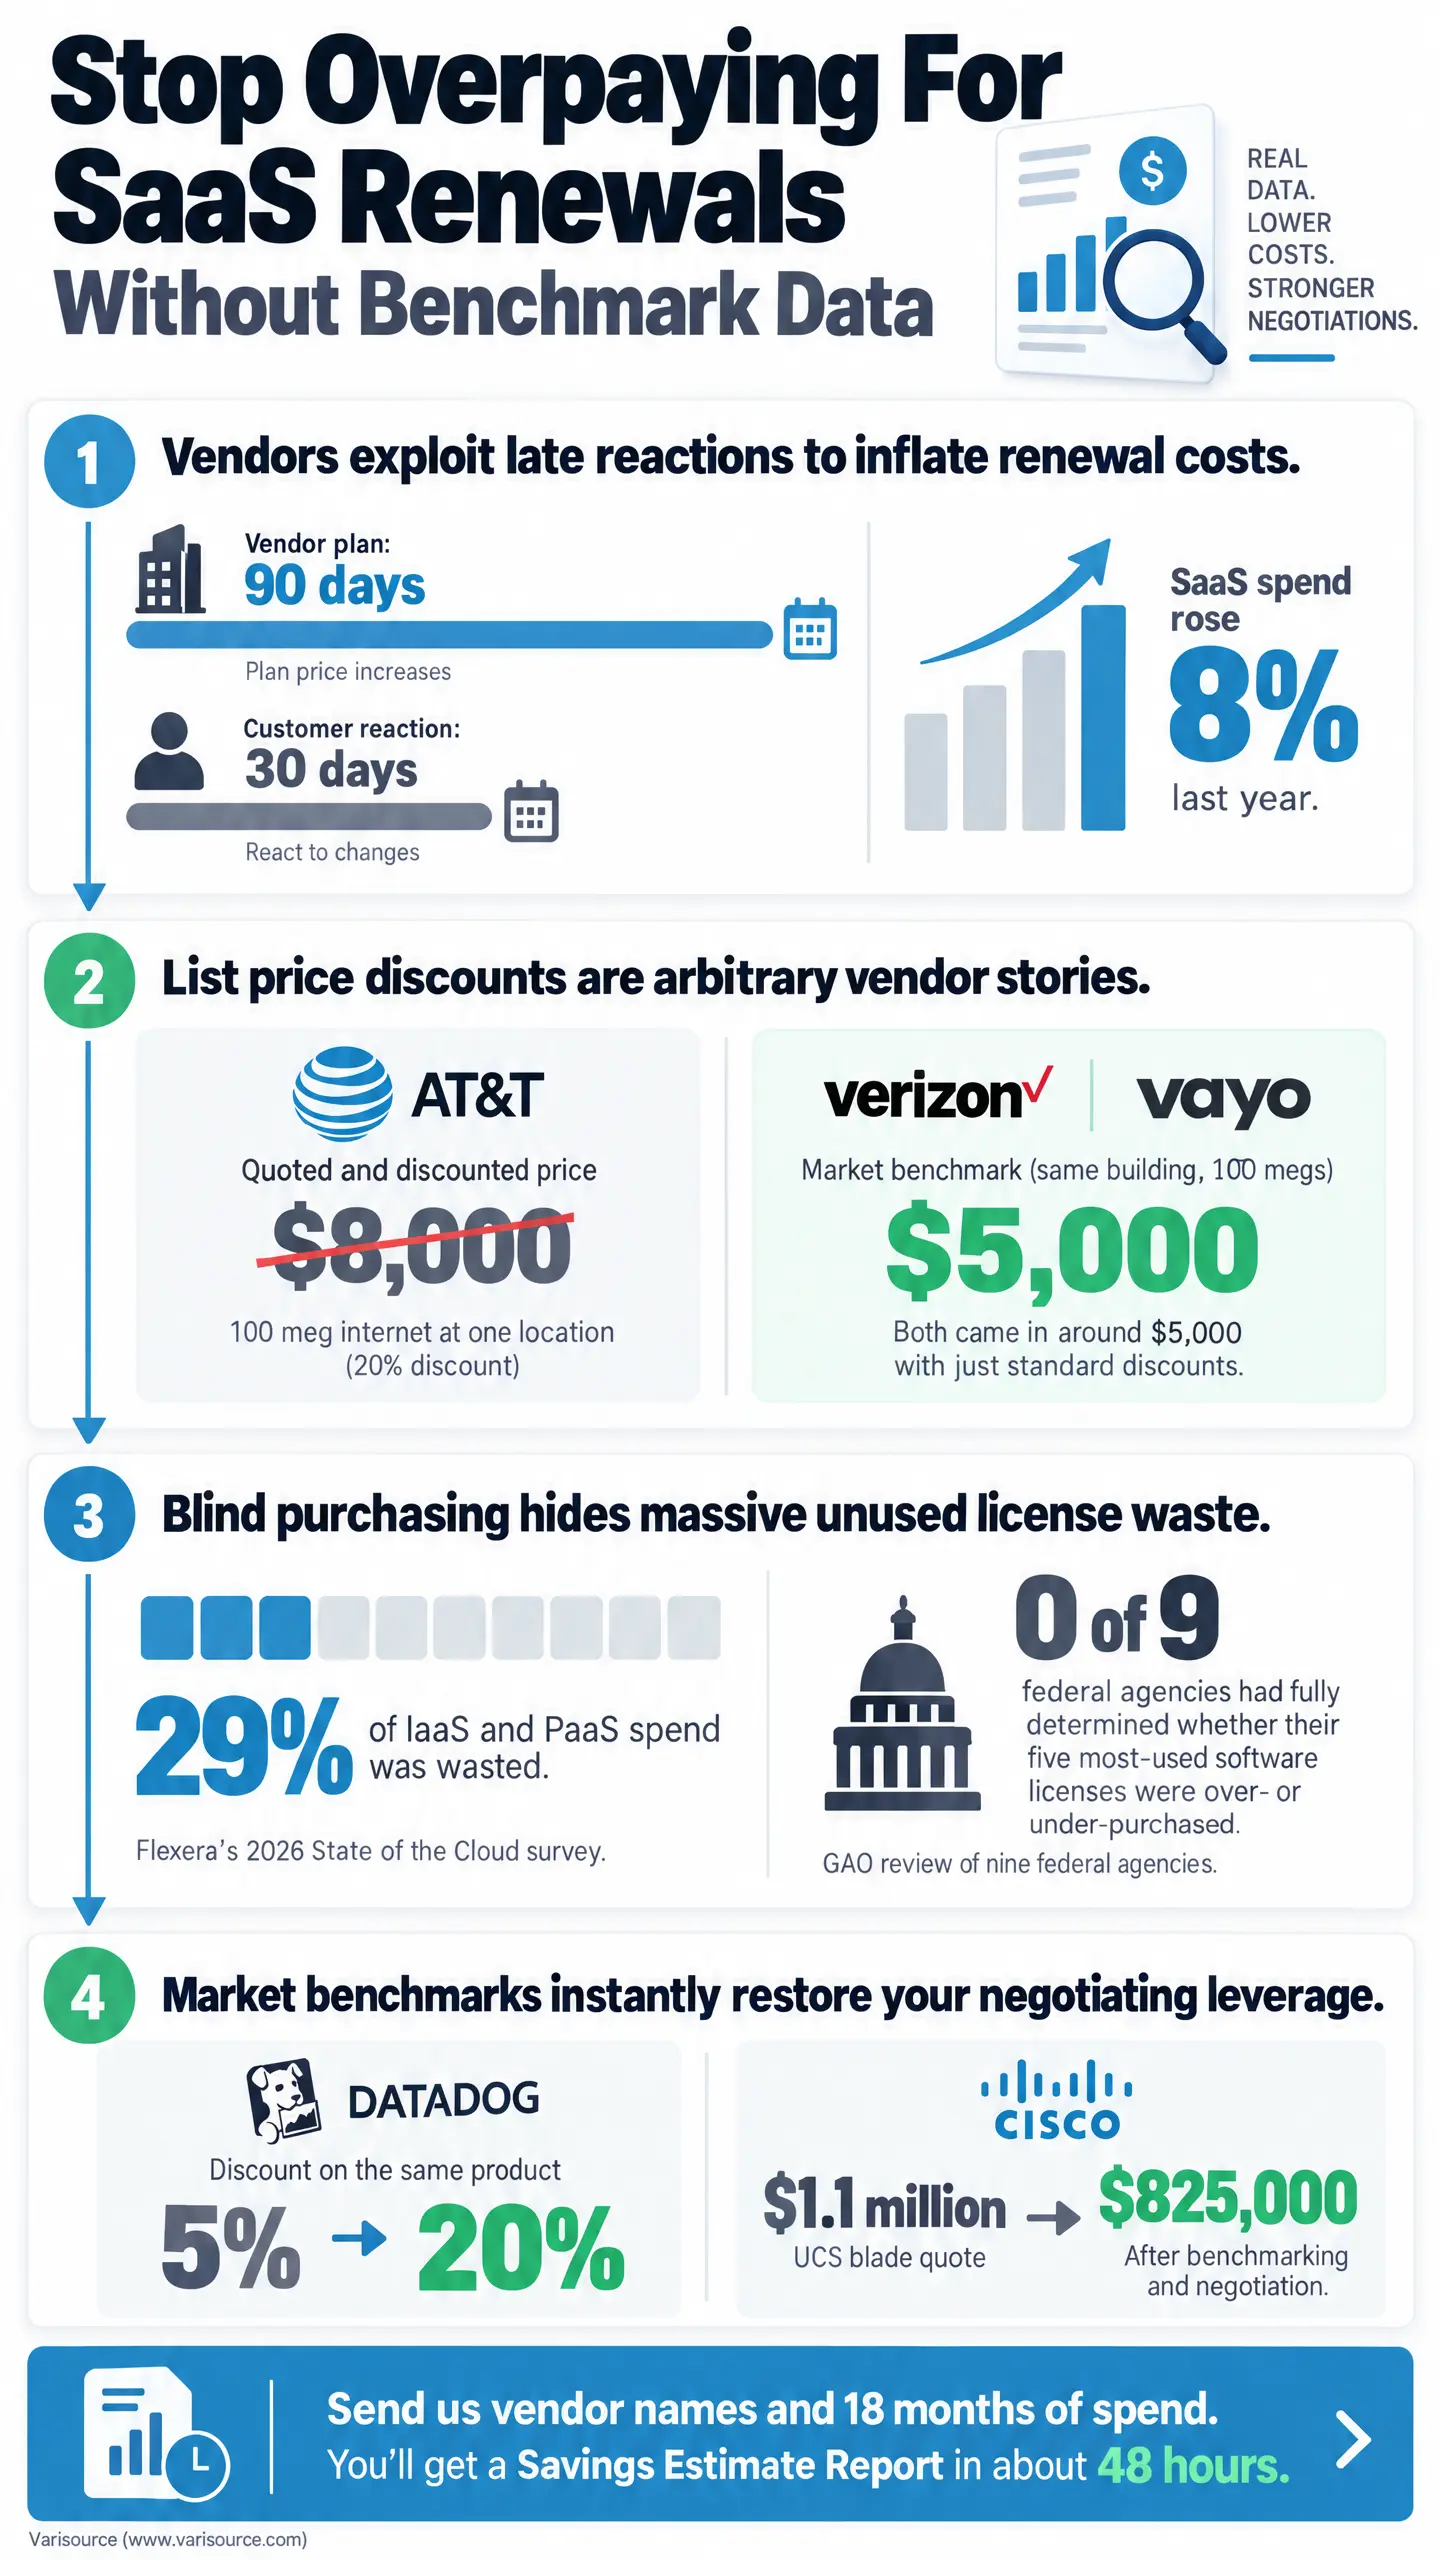
The number you add to the software line every year was chosen by someone on a sales team, roughly 90 days before it reached your desk. They know you'll give the renewal 30 days of attention, if that, and they price accordingly.
You file the difference under inflation and move on, which is precisely the plan. Zylo found SaaS spend rose 8% last year while application counts stayed flat, the same tools repriced, carrying no new value.
The skepticism that makes finance credible is the mechanism that launders a vendor's pricing decision into something that reads like the market in your board deck.
Key Takeaways
- SaaS vendors strategize renewal pricing 90 days in advance to exploit the standard 30-day reaction window of most corporate finance teams.
- The Bureau of Labor Statistics explicitly excludes business software from the Consumer Price Index, rendering vendor renewal increases justified by inflation impossible to verify against government benchmarks.
- Varisource contract benchmarking revealed that a 15% DocuSign renewal increase was applied to a baseline already priced 40% above the established market rate.
- Discount percentages obscure inflated list prices, demonstrated when an AT&T 20% discount on 100-megabit internet remained 60% above Verizon baseline rates for the identical address.
- A Government Accountability Office review revealed that zero out of nine federal agencies reconciled actual software usage against purchase records for their five most-used licenses.
- Zylo data indicates that 78% of IT leaders experienced unmodeled financial variance from unexpected consumption-based charges tied to new artificial intelligence software features.
How Do SaaS Vendors Strategize Renewal Price Increases Before Customers React?
Let me describe the 90 days before a big renewal from inside the vendor. The sales team gets together, strategizes, and builds a playbook for that one account. Obviously the goal of the playbook is to give the customer enough comfort that they never go out to market. You tell them the service has been great, the team put in a lot of effort, and the pricing they have is really, really good. None of it is a lie. The customer just never sees a second number.
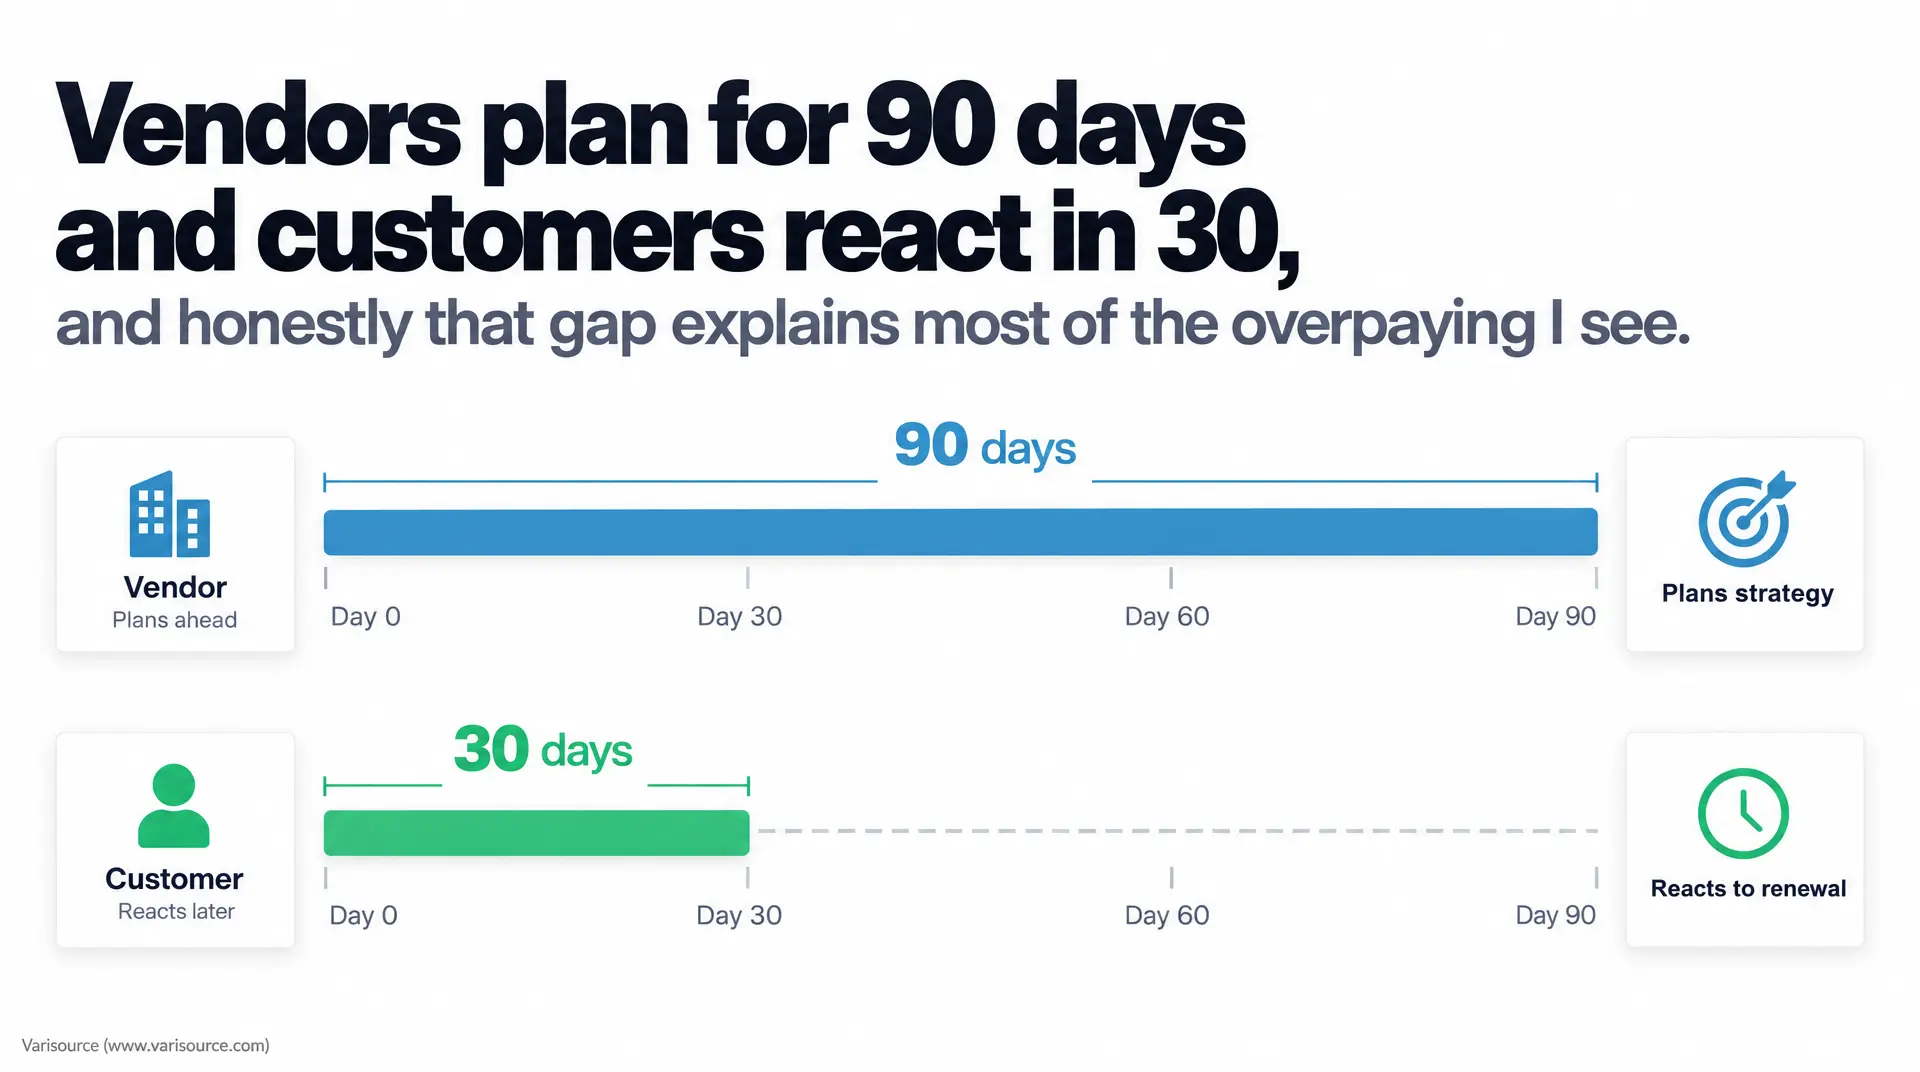
Meanwhile, on the customer side, the renewal gets attention about 30 days out, if that. Vendors plan for 90 days and customers react in 30, and honestly that gap explains most of the overpaying I see.
Vendors overcharge roughly 10 to 15% on the first contract, and it compounds from there, because after a renewal or two the vendor knows you are stuck. They know you're integrated and adding services, so the renewal gets upcharged and so do the new features. That's how tech spend drifts toward 25% of revenue when it should sit between 10 and 15, whether the company has 500 employees or 2,000.
One more thing for anyone tempted to check a vendor's "inflation" story against CPI. The Bureau of Labor Statistics excludes business software from the CPI, because households don't buy it. There is no government index you can hold a renewal increase against. The only reference that holds up is what other companies pay the same vendor for the same thing right now.
How Should Finance Teams Differentiate Actual Usage Changes From Arbitrary SaaS Renewal Price Increases?

When a renewal lands with a double-digit increase and you're the one explaining it, ask what actually changed from last year to this year, in license count, in usage, in the product itself. Whatever is left after that is the vendor's decision, and that's the part you shouldn't quietly absorb into the model.
A customer of ours had about 30,000 DocuSign envelopes. DocuSign raised the price roughly 15% and gave the usual reasons, a new product set, inflation, R&D investment. It all sounded plausible. When we ran the benchmark, the price before the increase was already more than 40% above what DocuSign charges other customers for the same envelopes.
Nothing had changed on the customer's side. The 15% was a pricing decision on top of a baseline that was already inflated, and the finance team pushed back with confidence because they were holding DocuSign's own pricing to other customers.
That market price is the column missing from most models. You have last year's spend by vendor but not what the market pays for the same SKU, so you can't separate market movement from vendor opportunism, and the vendor's decision ends up in your board deck looking like the market.
What Are the Core Data Components of an Accurate Vendor Pricing Benchmark?
Good FP&A people are skeptical of unsourced data, and they should be. A price point from Google or ChatGPT gets dismissed in a budget review within a minute, because those numbers come from the internet and the internet doesn't see contracts.
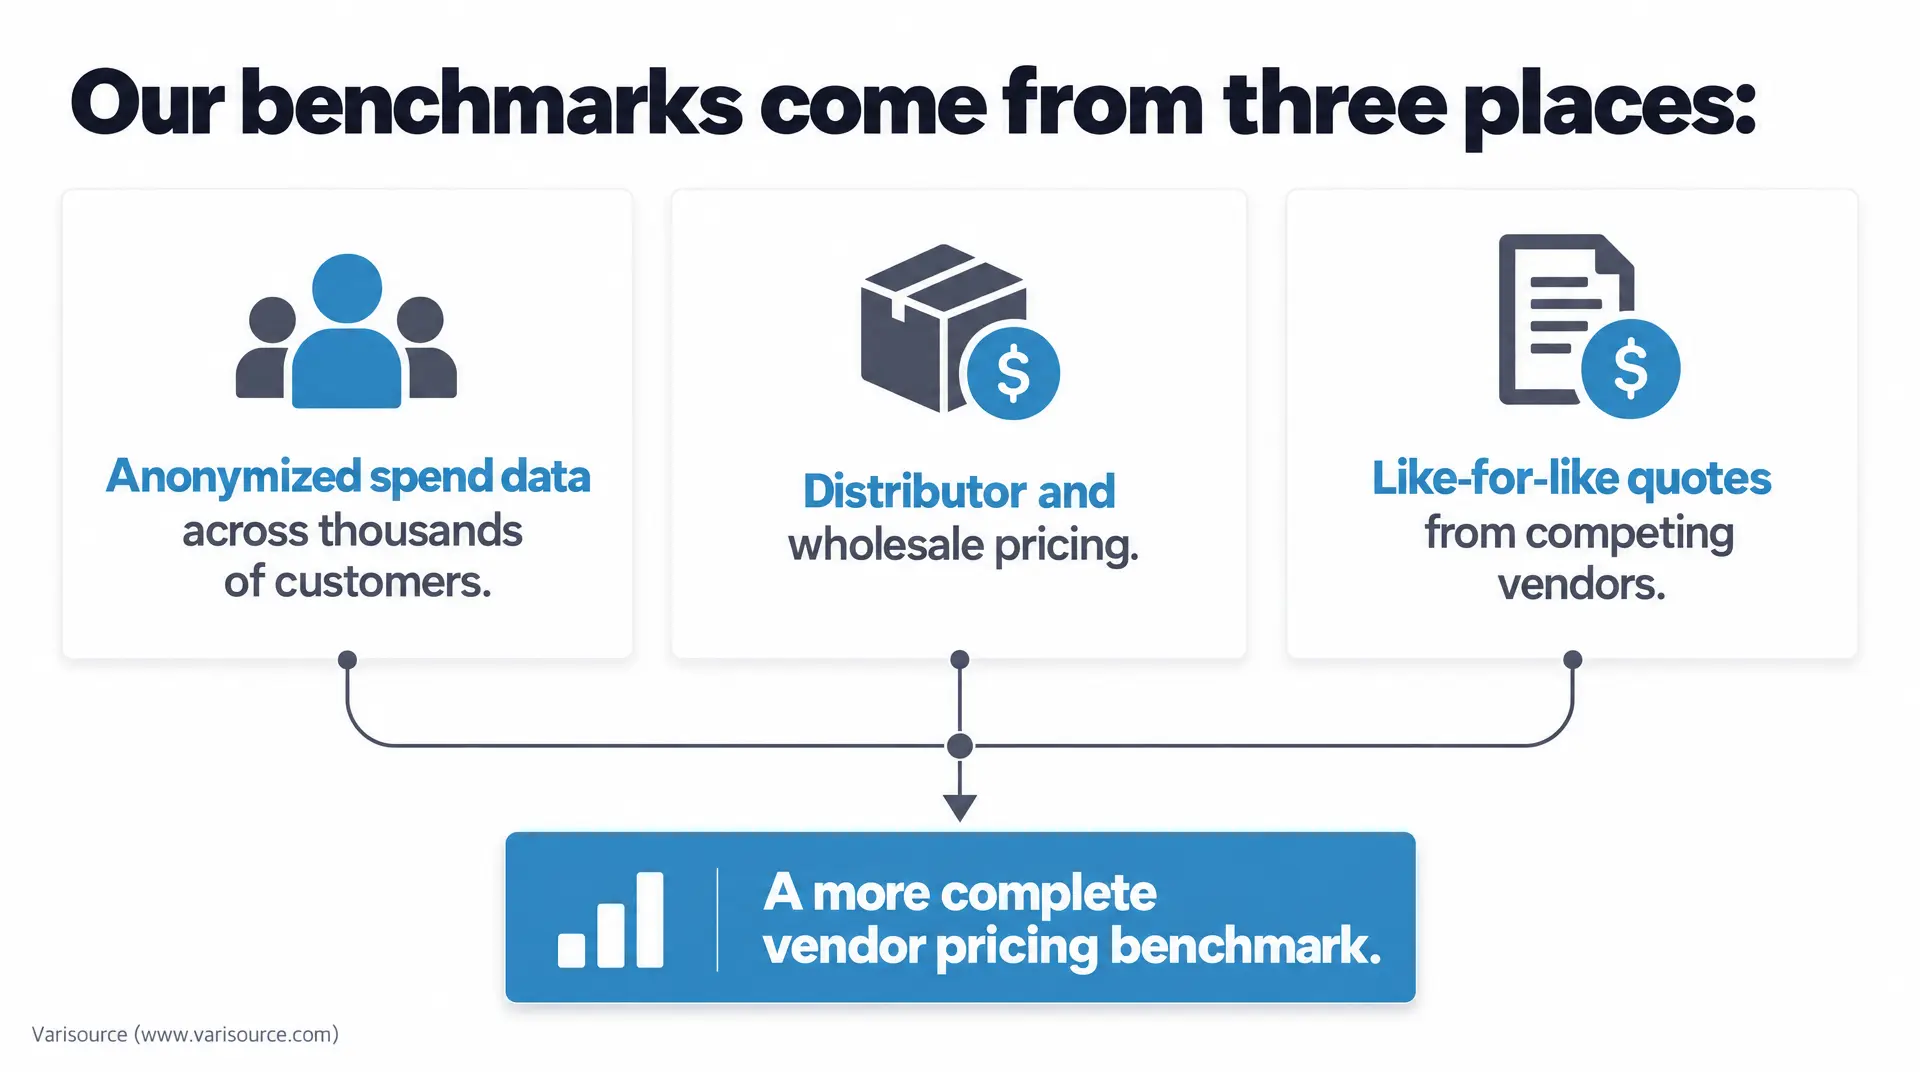
Our benchmarks at Varisource come from three places. The first is anonymized spend data across thousands of customers, showing what companies actually pay across roughly 100,000 vendors and 500 categories. The second is distributor and wholesale pricing, which tells us what the vendor paid and what margin it's carrying. When I was a vendor we'd buy at a low margin and sometimes charge over 200% because the customer could afford it, and that bothered me enough that my brother Jackson and I eventually started this company to fix it. The third is like-for-like quotes from competing vendors, which is what turns information into leverage, because the current vendor sees those numbers before you ever have to threaten to leave.
Then the quote gets broken down SKU by SKU, comparing the discount other customers get per license type and quantity against what this customer is getting. A lot of times the vendor isn't charging other customers for support at all, but it's charging this one. A Workato customer was paying for premium support that came to 15% of the whole contract. We asked the vendor how much support had actually been used and they couldn't answer clearly. We asked the customer and the answer was rarely. The line came off.
Why Are Vendor List Price Discounts Meaningless Without Comparable Market Benchmarking Data?

Discounts are tricky because a discount comes off a list price, and the vendor set the list price. AT&T quoted a customer 100 meg internet at one location for $10,000 and offered a 20% discount, bringing it to about $8,000. On paper that looks like a solid negotiation.
We benchmarked Verizon and Vayo in the same building for the same 100 megs, and with just standard discounts both came in around $5,000. AT&T's discounted price was still 60% above market for the identical service at the identical address.
Business buyers have no Zillow or Expedia to see what everyone else paid, and vendors know it, so a list price with no public reference can be anything and so can the discount off it. For your model, a discount percentage is a vendor's story about its own list price. Only the like-for-like market number tells you what the service is worth.
How Do Analysts Identify Overpriced Software and Telecom Spend in an Accounts Payable File?
Before any software touches a spend file, I spend about 10 minutes with it, and all it takes is vendor names and 18 months of spend, which you already control.
I sort top to bottom and look at total dollars and total vendor count to see how much of the estate is addressable. Then I look at the top categories. If cloud, software, telecom, or insurance sit near the top, there's money, because those are the categories most reliably overpriced, cloud at 25 to 35% in typical savings, software at 15 to 25, telecom at 20 to 30. Then I look for consolidation candidates, meaning several vendors doing the same job. We found one company paying for four different CRMs in parallel, left over from acquisitions nobody ever cleaned up.
The same scan turns up things nobody would believe. Close to $1 million of Microsoft bought on a corporate credit card, which means list price. A $1.1 million line item for an office and project that had already shut down, still billing because the contract kept auto-renewing and no one noticed. Companies spend a lot of money, but they don't spend money to track the spend.
How Should Finance Execute Board-Mandated Cost Cuts Using Vendor License Utilization and Contract Analysis?
When a board mandates cuts, FP&A builds the plan, usually without the contract-level facts to know what's safely cuttable. That's how panic cutting happens, where somebody cancels a contract with more penalty left than savings, or kills a tool without knowing which team depends on it.
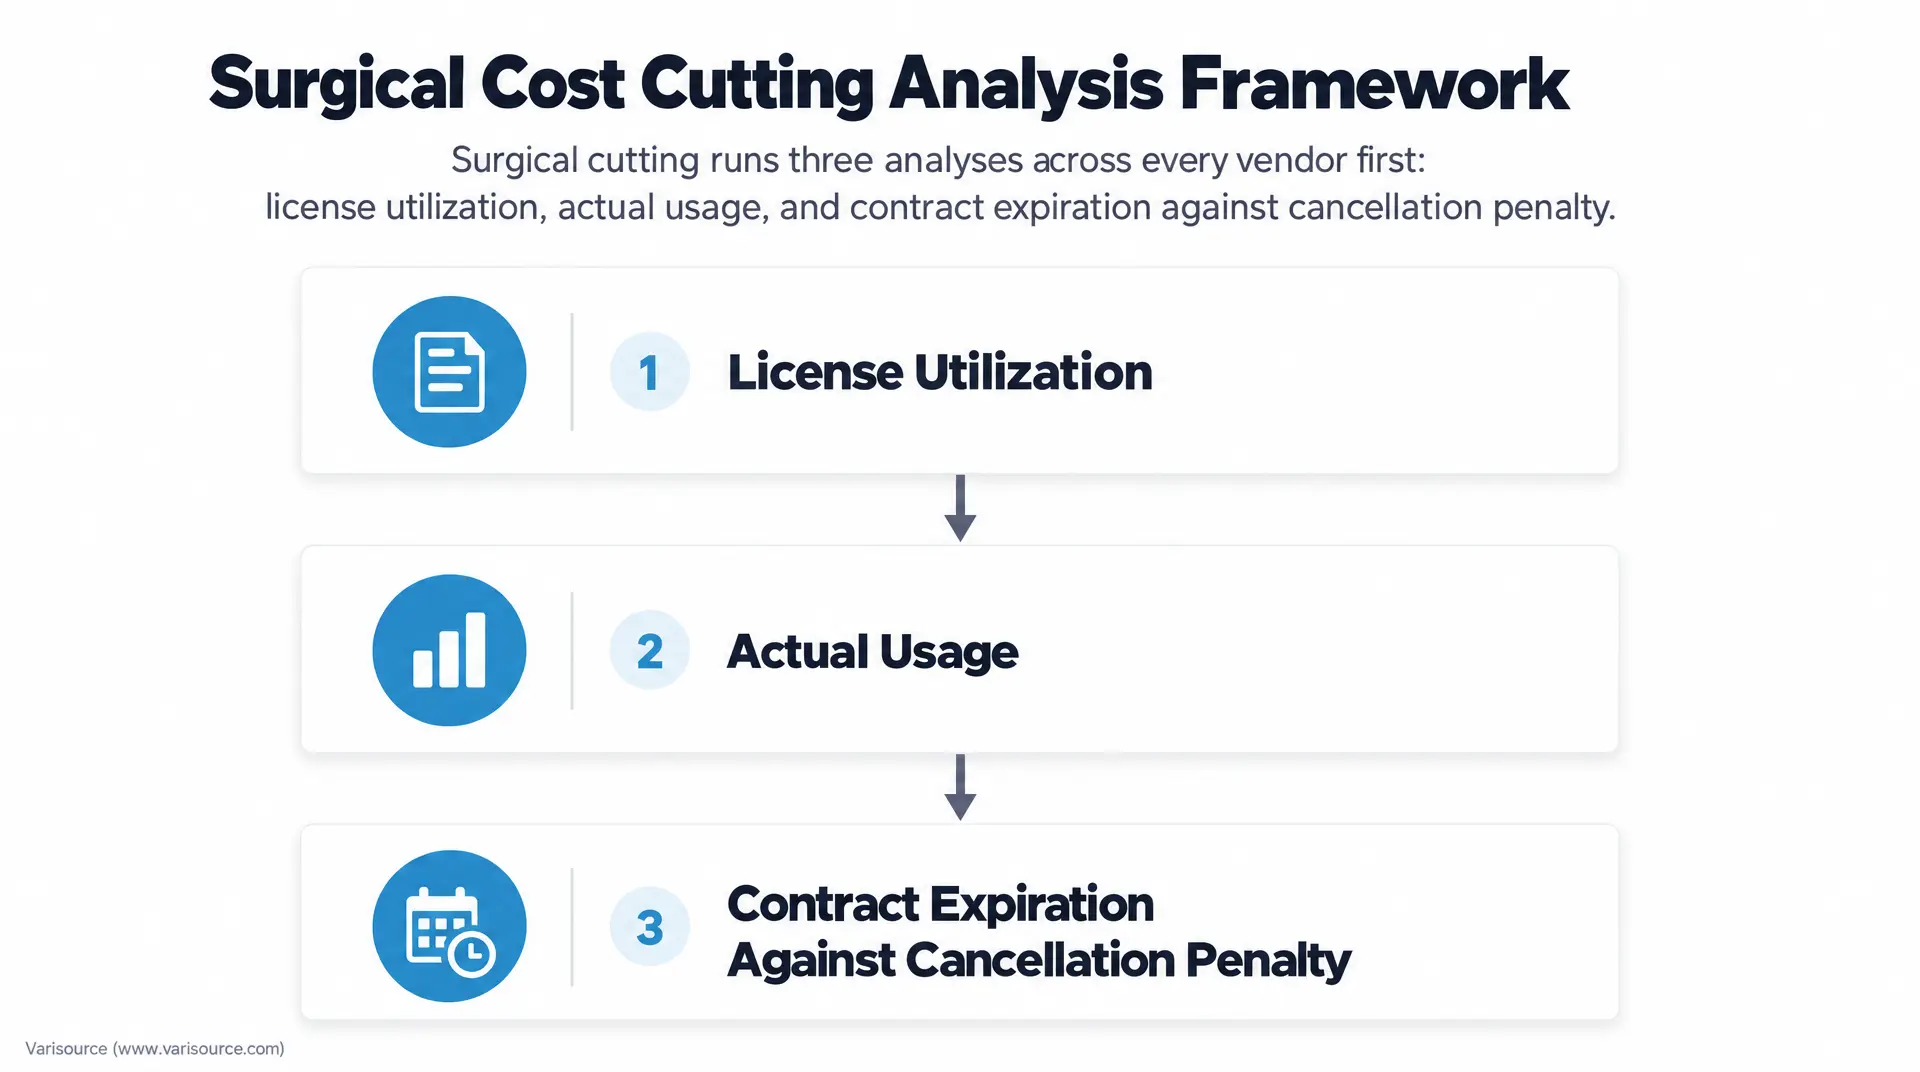
Surgical cutting runs three analyses across every vendor first: license utilization, actual usage, and contract expiration against cancellation penalty. Even the first one is harder than it sounds. GAO reviewed nine federal agencies and found not one had fully determined whether its five most-used software licenses were over- or under-purchased, because nobody reconciled real usage against purchase records. Once that work sits on a vendor-by-vendor schedule, you know what moves this quarter and what waits for its renewal date.
Cloud usually moves first. In Flexera's 2026 State of the Cloud survey, respondents estimated 29% of their IaaS and PaaS spend was wasted, and 17% had exceeded their public cloud budget in the past year. Most companies buy on demand or one-year terms to keep flexibility. We get customers three-year term discounts on month-to-month flexibility across EC2, compute, savings plans, and reserved instances, which is where most of the cloud savings come from.
The majority of our savings keep the same vendor and the same service, which should reassure your IT stakeholders. Datadog told us on the first call they couldn't reduce price, because it's a usage product and they'd already given their best discount. Several calls later, after we built competition and optimization options, the discount went from 5 to 20% on the same product. A $1.1 million Cisco UCS blade quote came down to about $825,000 the same way. And when a software vendor warns that a lower price means lower quality, remember the software is already built. It doesn't get worse because you stopped overpaying for it.
Why Must Vendor Contract Renewal Calendars Be Integrated Into Financial Forecasting Models?
Leverage is information and competition plus the time to use them. Simply telling a vendor to give you a better price is worthless, because if you don't have leverage they're not going to do anything.
Almost every negotiation we lose, we lose on time. A customer comes to us two weeks before renewal with a vendor wired into their systems, and the vendor knows nobody switches in two weeks. We reminded one customer several times about an upcoming renewal, and by the time anyone responded they'd been auto-renewed for three years. If the vendor plans 90 days out, you need to be at least that early, so renewal dates belong in the forecast right next to the dollars.
How Can Finance Teams Manage Unexpected Consumption-Based AI Software Spend in 2026?
Companies are buying AI tools faster than anything I've watched in this industry, and finance usually sees the charges after the budget is gone. Zylo found that 78% of IT leaders had unexpected charges tied to AI features or consumption-based pricing, which is variance nobody modeled.
The first move is connecting your spend analytics to your AI tools the way you'd connect them to your ERP, so usage shows up before the invoice does. Then you need a methodology, because tracking AI spend and optimizing it are two different problems. The FinOps Foundation's 2026 survey found 98% of respondents now manage AI spend, up from 31% two years earlier, still the same report notes teams usually handle allocation, forecasting, and reporting well before they reach optimization. We see 20 to 30% savings in AI tools once the spend is visible. It's a data problem and a people problem long before it's a tool problem.
How Do Private Equity Operating Partners Evaluate the Return on Investment for Vendor Spend?

PE operating partners ask one question corporate CFOs rarely do: what is the ROI, the who, what, when, why, and how, of every vendor and every dollar of spend? The FP&A leader with that answer ready is the one the board trusts on the next decision.
The rule I'd tape to your monitor is that every spend dollar with a vendor has to have an ROI, and it has to be a mandate from the top with the authority to act on it.
If you want to see what's in your own file, send us vendor names and 18 months of spend. You'll get a Savings Estimate Report in about 48 hours, free, with no commitment. We only get paid when we save you money, and you keep 80 to 85% of the savings. Present it as your own analysis, because that's exactly what it is.
Frequently Asked Questions
How should FP&A measure cloud cost-cutting strategies beyond simple spend reductions?
A blanket spend-to-revenue ratio isn't enough. According to Flexera's 2026 report, 49% of respondents now use unit economics to assess cloud costs. By measuring cost per service or business outcome, you transform an arbitrary cost mandate into a strategic efficiency metric your board can actually track.
How do unplanned SaaS cost increases impact broader corporate budget strategies?
Vendor opportunism silently cannibalizes growth. Zylo's 2026 report reveals that 61% of IT leaders cut projects due to unplanned SaaS costs. When you lack market benchmarks to fight renewal hikes, you inevitably fund vendor margins by sacrificing your own company's internal innovation.
Why is historical purchase data insufficient for executing software cost-cutting mandates?
Past invoices only tell you what you paid, not what you needed. A GAO review of nine federal agencies found none could fully determine if their top licenses were over-purchased. Without reconciling actual system usage against purchase records, FP&A risks cutting critical tools while leaving massive shelfware untouched.
What hidden vendor traps should finance watch for when migrating infrastructure to the cloud?
Restrictive software licensing often creates unbudgeted double-payments. A recent U.S. GAO report found that vendors frequently force organizations to repurchase identical licenses just for cloud use. If FP&A doesn't model these licensing penalties upfront, the projected savings of your cloud migration strategy will evaporate immediately.
How large is the typical SaaS estate that middle-market FP&A teams must analyze?
The baseline sprawl is larger than most models assume. Zylo's 2026 SaaS Management Index tracks an average portfolio of 305 applications and $55.7 million in annual spend. Without centralized tracking and market-priced benchmarks, executing a 20% cost-cutting mandate across 300 disconnected vendors becomes an exercise in blind guesswork.
About the Author
.jpeg)
Victor Hou
Victor Hou is the founder of Varisource, the first ever Savings Automation Platform that automates Savings for Your Business. Victor helps companies access discounts, rebates, benchmark data, savings for renewals and new purchases across 100+ spend categories automatically to increase your company's margins and equity value by at least 15-20%. Victor is active and passionate about using AI + automation to help your business save time, money and run more efficiently.
%201.svg)

Varisource’s Savings Automation Platform guarantees savings and maximized leverage on every dollar spend across 100+ spend categories


